Resource Libraries
Do Amalgam Fillings Raise Mercury Levels in Blood and Urine?
What biomonitoring shows about amalgam fillings and mercury in blood, urine and brain tissue, and why more filling surfaces means measurably more mercury.
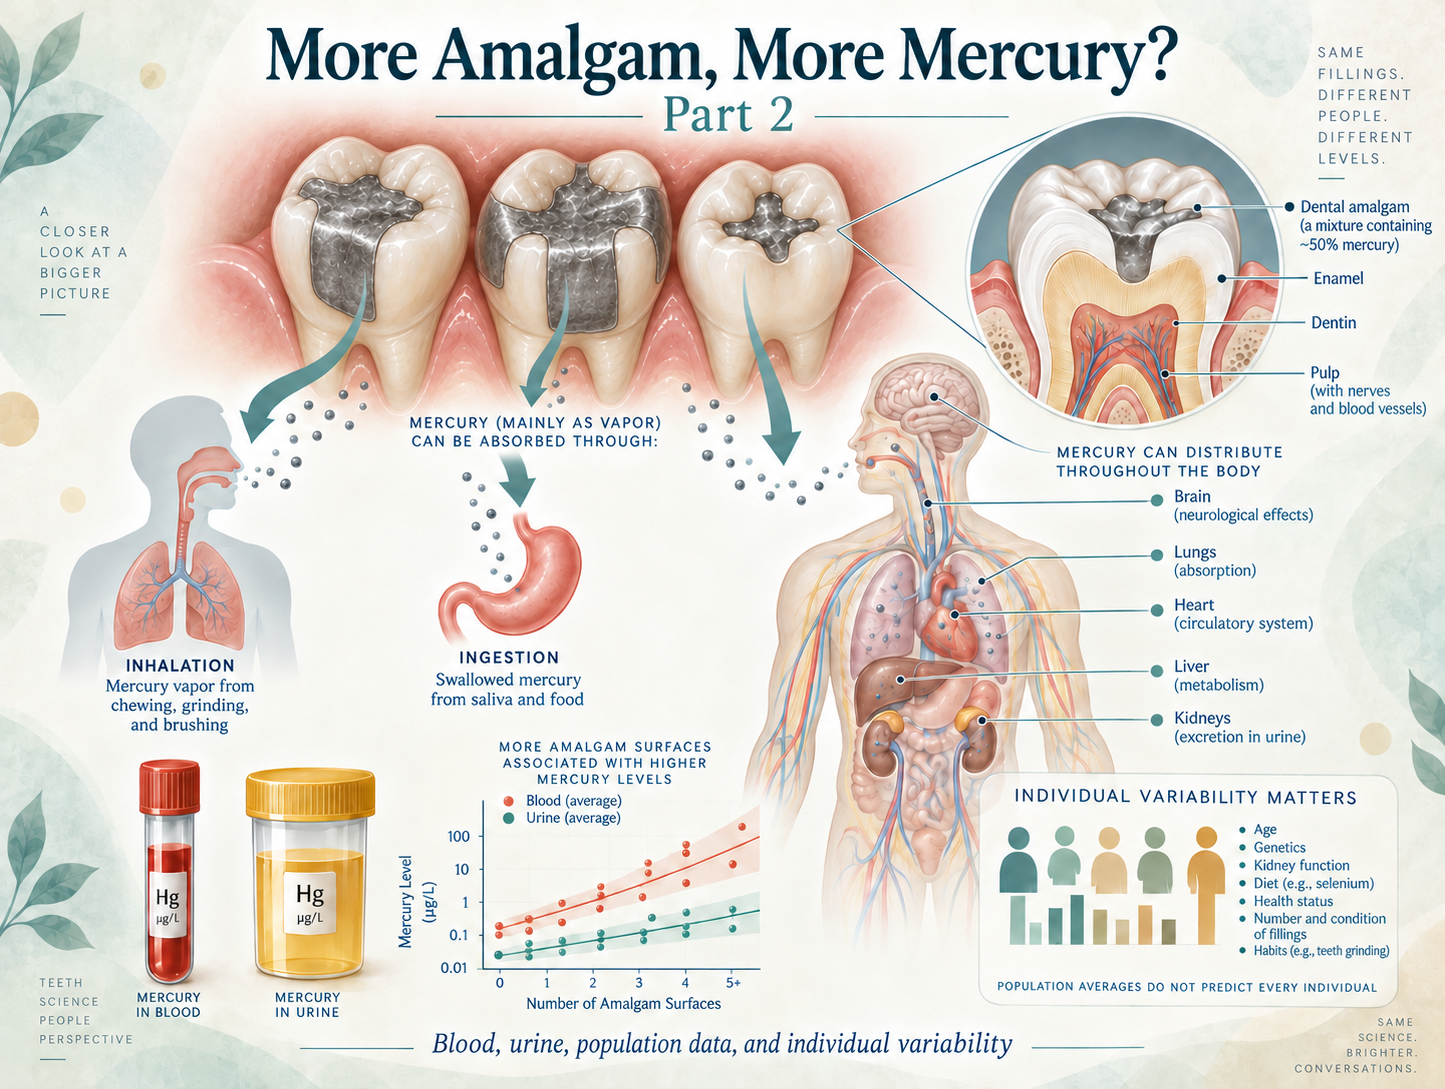
Part 2 of 12 in the Mercury Series
More Amalgam, More Mercury: What Human Biomonitoring Actually Shows
Part 2 of the Mercury Amalgam Series
In Part 1 of this series, we answered the first question: Does mercury actually leave an amalgam filling after it hardens? Yes.
Researchers have directly measured mercury vapor coming from amalgam restorations, and they’ve shown that chewing, heat, brushing, polishing, and other mechanical manipulation can increase that release. So the next question is pretty obvious:
If mercury is leaving the filling, can we actually measure more mercury inside people who have more amalgam?
Again, the answer is yes.
And this time we aren’t just talking about mercury vapor floating around inside somebody’s mouth. Researchers have measured mercury in urine and blood, followed people over time, compared people with and without amalgam, and examined what happens as the number of amalgam-restored tooth surfaces increases. The overall pattern is remarkably consistent:
More amalgam exposure generally means more measurable inorganic mercury in the body.
That statement does NOT mean every person with amalgam has mercury poisoning. It doesn’t tell us whether one particular person will develop symptoms. And it definitely doesn’t tell us exactly how much mercury is sitting inside every tissue in the body. People are not cookie cutters, and this is important context to have moving forward. But it does answer an important question: The mercury leaving those fillings doesn't simply vanish.
A Quick Note About the Reference Numbers
Just like Part 1, the regular reference numbers in brackets—such as [17] or [20]—are the exact same numbers used in the complete master mercury article. I’m keeping them that way on purpose. That means if you see reference [20] here, it is exactly the same reference [20] in the master article. The numbering may occasionally skip because each shorter article uses only the science that applies to that particular topic.
If I ever add a source specifically to clarify something in one of these shorter articles that wasn’t included in the master article, I’ll label it separately as an article-only reference, such as [A1].
At the bottom of this article, I’ll give you the complete citations and direct links for every study used here, so you don’t have to go digging through the 30,000-word master article unless you actually want to.
We Can Measure the Difference in Children
Some of the clearest evidence comes from children because two large randomized clinical trials gave researchers the opportunity to follow mercury exposure over several years. In the New England Children’s Amalgam Trial, researchers measured urinary mercury during years three through five of follow-up. They found that every additional amalgam surface currently present was associated with about a 9% increase in urinary mercury. They also calculated cumulative exposure over time and found that each additional posterior chewing-surface year of amalgam exposure was associated with about a 3% increase in cumulative urinary mercury excretion. [17]
That’s important because the exposure followed a dose-related pattern. More amalgam surfaces equaled more measurable mercury.
A separate analysis of children in the Casa Pia Children’s Amalgam Trial found the same basic relationship. As cumulative amalgam exposure increased, urinary mercury increased with it. Children with average amalgam exposure had urinary mercury levels approximately 18–52% higher, depending on age, than children with no amalgam exposure. [18]
Then researchers in Korea followed hundreds of children longitudinally and found essentially the same thing again.
Both current amalgam exposure and accumulated amalgam exposure predicted urinary mercury concentrations over time. [19]
- Different researchers.
- Different children.
- Different countries.
Same basic pattern.
The greater the amalgam exposure, the more mercury researchers tended to measure in the urine.
And urine matters because inorganic mercury is eliminated substantially through the kidneys. Measuring more mercury in urine doesn’t tell us exactly how much is stored in somebody’s brain, thyroid, kidneys, or other tissues. We’re going to get to tissue distribution later in this series. But it does tell us that mercury entered the body and is being excreted.
Then NHANES Made the Numbers Much Harder to Ignore
The numbers become particularly interesting when we move beyond individual clinical trials and look at large U.S. population data. Researchers analyzed National Health and Nutrition Examination Survey—NHANES—data from 14,181 participants across multiple age groups. [20]
They were also able to look at different forms of mercury. That matters because mercury from seafood is primarily associated with methylmercury, while dental amalgam releases elemental mercury vapor, much of which is converted in the body to inorganic mercury. So if somebody eats a lot of fish and has a high total mercury level, we can’t automatically point at their fillings and say, “Aha! Amalgam.” The researchers tried to separate those sources. Seafood consumption was associated with methylmercury, exactly as we would expect. But amalgam exposure was strongly associated with inorganic mercury in blood and mercury in urine. [20]
Among participants who reported no fish consumption, those with more than five amalgam-restored tooth surfaces had:
-
103% higher total blood mercury
-
221% higher blood inorganic mercury
-
221% higher creatinine-corrected urinary mercury
compared with people without amalgam-restored surfaces. [20]. That is a VERY different picture from the idea that the mercury stays permanently locked inside the filling and never becomes biologically available. But there’s an important detail here that I think is incredibly easy to misunderstand for someone not in the dental field, so let's discuss it.
A “Filling” Is Not the Same Thing as an Amalgam Surface
When patients hear “five amalgams,” they picture five separate teeth with five silver fillings. That's NOT necessarily what these studies are measuring. NHANES dental examinations record restorations surface by surface. A tooth can have a restoration on the chewing surface, the cheek side, the tongue side, the front surface, the back surface—or several of those surfaces at the same time. [20,22]. Dentists use names such as mesial, occlusal, distal, buccal, and lingual to describe those areas. So one enormous amalgam restoration covering five surfaces of a molar can count as five amalgam-restored surfaces all by itself.
It's important to understand that because the distinction matters. A tiny one-surface amalgam barely larger than a pencil tip and a giant MODBL restoration replacing most of a molar crown obviously do not contain the same physical amount of mercury. But NHANES doesn’t tell us the exact volume, depth, alloy composition, or actual milligrams of mercury contained in each restoration. It tells us which tooth surfaces contain amalgam. [20,22]
So surface count is a useful exposure marker, but it's not the same thing as measuring the actual mercury mass sitting in somebody’s mouth. That’s an important limitation.
And it may actually mean our exposure estimates are less precise than people assume. Two people could both have “five amalgam surfaces” and still have very different actual amounts of material.
The Youngest Children Deserve More Questions, Not Fewer
There was another finding in that NHANES analysis that caught my attention. In the youngest category—ages 1 through 6—43 participants had more than five amalgam-restored surfaces. That small subgroup had the highest blood inorganic-mercury and urinary-mercury concentrations of any age category examined. [20]. That's striking.
But it's important to be very careful with it because 43 children is a small subgroup. It doesn't prove that every young child with amalgam will have exceptionally high mercury. And it doesn’t establish some magic age below which amalgam becomes toxic and above which it suddenly becomes harmless. What it tells us is that, within this dataset, the youngest children with the greatest amalgam-surface burden had particularly high measurable inorganic mercury. That deserves attention. And it certainly doesn’t support the idea that amalgam exposure somehow doesn’t “count” simply because the patient is young.
More recent NHANES research has found the same basic relationship in adults. Adults ages 18–70 with amalgam had significantly higher total blood mercury and inorganic blood mercury than adults without amalgam, and the number of amalgam surfaces significantly correlated with blood inorganic mercury. [21]. So the relationship isn't confined to one pediatric trial or one country. Again and again studies showed that:
More amalgam is associated with more measurable inorganic mercury.
But How Much Is “Too Much”?
This is where things become considerably more complicated. Once researchers established that amalgam burden correlates with mercury biomarkers, another question naturally followed:
How do the estimated mercury doses from amalgam compare with health-based exposure reference values?
One U.S. population model estimated daily mercury exposure from amalgam using national data on body weight, restored surfaces, and the relationship between amalgam burden and urinary mercury. [23]. Even using the study’s least conservative amalgam scenario, the authors estimated that approximately 67.2 million Americans would exceed the dose associated with the U.S. EPA reference concentration they used, while approximately 122.3 million would exceed the more protective California-derived value. [23]
A newer analysis using 2015–2018 NHANES data produced another uncomfortable set of estimates. The researchers calculated that approximately 16.4 million adults—10.4%—would exceed the U.S. EPA-based value, while approximately 85.9 million adults—54.3%—would exceed the more restrictive California EPA-based value. [24]
Now, before anybody turns those numbers into “86 million Americans have mercury poisoning,” STOP. That is NOT what those studies say. These are models. They estimate exposure using population data and assumptions. They aren't blood tests or tissue biopsies or diagnoses. And the enormous difference between the EPA-based and California-based numbers actually illustrates something really important:
When somebody says an exposure is “below the safe limit,” my next question is: Which limit? Because different agencies can use different assumptions, uncertainty factors, populations, endpoints, and levels of precaution. And the model still cannot tell us what is happening inside one particular human being.
We Aren’t Cookie Cutters
This may be the single most important part of this entire mercury series for me. Population averages, large datasets, and exposure models are useful. But the human being sitting in front of me is not a population average.
Account required
Sign in to see more
Create an account or sign in to unlock the full list.